

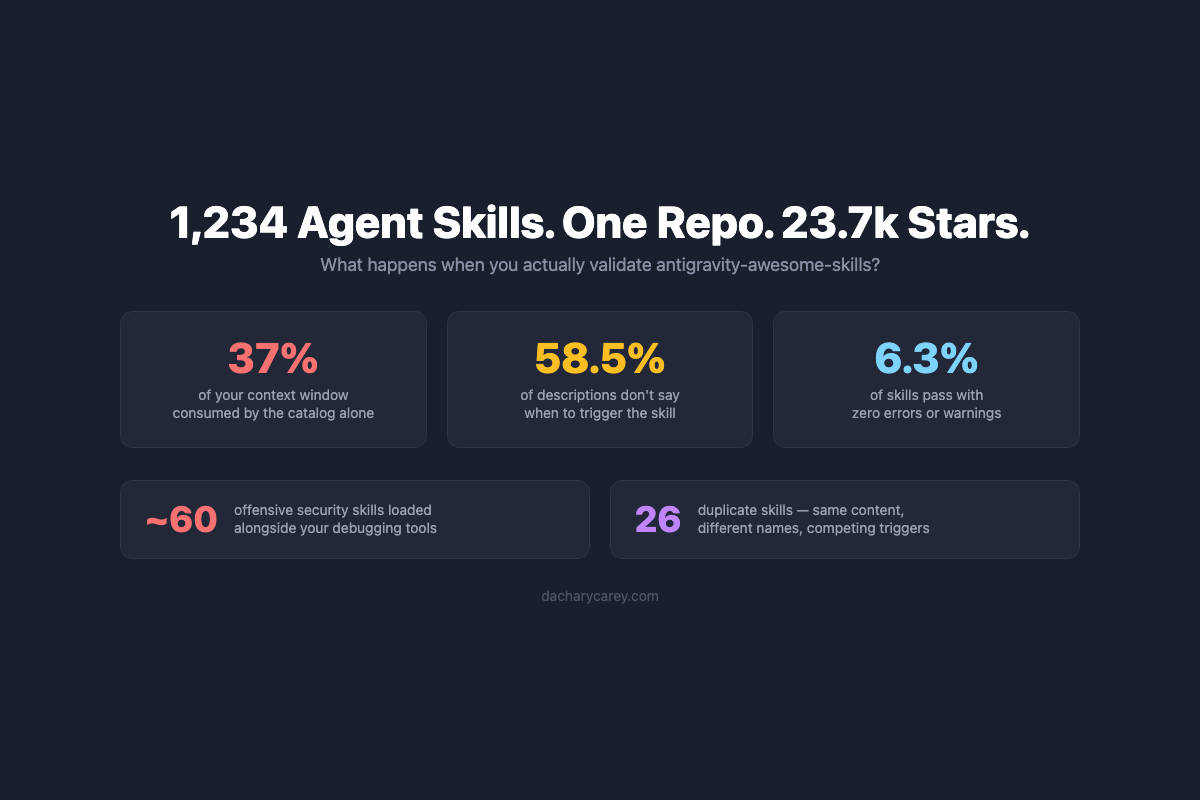
Agent Skill Mega Repo Woes
In which I validate a 23.7k-star skill mega repo and discover problems the star count won't tell you.
With our code example audit data ingested into the database, we were no longer constrained to static analysis at the time of parsing the data. We had the freedom to analyze the data in a variety of different ways as we explored different theories and questions. I started with a simple count of code examples broken down by programming languages. As I explored the data, this evolved into 19 different queries (at the time of this writing) to break down the data in different ways.
For the queries I discuss in this article, each section contains:
For more information about how we modeled the data we’re working with here, refer to the Modeling Code Example Data article.
I provided the data from these queries as appendices to the final audit report. The output tables in the audit report represented approximately 60 pages of data. I also run some of these queries regularly for ongoing reporting.
This is a lot of information to drive audit findings and ongoing analysis and reporting within our organization.
Since this article is lengthy, and you may want to refer to a specific section later, I’ve provided a ToC for convenience:
Note: Some sections build on concepts introduced earlier. For best understanding, consider reading the article in order, but feel free to use the table of contents to revisit specific topics.
For our data analysis, most of my queries output numerical counts of various sub-groupings relative to a total group size. My tooling prints these counts to console as tables, and we copy those to other formats depending on where/how we present them.
To help contextualize the numbers, I add a summary line to every table I generate that contains the total number of code examples we discuss in the table, and a “% of Total” field to help viewers quickly understand what the count represents relative to the total group size represented in the table. So, for example, our “Code example counts by programming language” table looks something like this:
The total count of code examples across all programming languages is: 35,457

+-----------+-----------+------------+
| Language  | Count     | % of Total |
+-----------+-----------+------------+
| Bash      | <number>  | <percent>  |
| C         | <number>  | <percent>  |
| C++       | <number>  | <percent>  |
| etc.      | <number>  | <percent>  |
+-----------+-----------+------------+
This makes it easy for people to parse that, for example, the ~10,000 JavaScript code examples across our documentation represent 28.6% of our total code examples.
When I break totals down into sub-counts by different types of groupings - for example, when I break programming language counts down by documentation set - I output an individual table representing the values for each element of the sub-count. I am currently parsing 39 documentation sets - 38 of which have live, published pages. So when I run the “programming language counts by documentation set” query, I output 38 tables; one for each documentaion set.
At the highest level, we wanted to understand the distrubution of code examples across our documentation. I knew from our initial static report that we had around 35,000 code examples. So I wrote a few different queries to get code example counts by:
For each of these data slices, I wrote a few different queries to get counts by:
For docs team leads and individual contributors, we may want to understand the breakdown of code example counts for a given documentation set. For example, of the 39 documentation sets we’re currently parsing, my team might want to quickly find the breakdown of code example counts for each of the 4 documentation sets we maintain.
This makes it easier for leads and docs team members to understand the corpus of code examples their team is responsible for.
This is a starting point to get a high-level summary of how many code examples exist in a given documentation set.
This query:
summariescode_nodes_total field that contains the count of code examples currently on the pageFor this query, we represent the data as a map[string]int. Each string key is the name of the documentation set. The int value is the total count of code examples in that documentation set. The data looks like map[documentation-set]code-example-count.
This example outputs one table that breaks down the counts segmented per documentation set, where the table resembles:
The total count of code examples across all documentation sets is: <number>

+-----------------------+-----------+------------+
| Documentation set     | Count     | % of Total |
+-----------------------+-----------+------------+
| Atlas CLI             | <number>  | <percent>  |
| Atlas                 | <number>  | <percent>  |
| Atlas Operator        | <number>  | <percent>  |
| etc.                  | <number>  | <percent>  |
+-----------------------+-----------+------------+
When the audit project started, a stakeholder requested we provide a breakdown of code examples by programming language. I normalized our programming languages as part of ingesting the code example data, so every code example across our documentation was attributed to one of 21 “canonical” programming languages. (Or “undefined” where no language was provided or where the provided language did not normalize to one of our canonical languages.)
This was a large volume of data, so I also wrote a simple query to get a count of code examples in a specific programming language within a specific documentation set. This enabled me to easily check, for example, how many JavaScript code examples are in our Node.js Driver documentation.
Based on the data model I discussed in the Audit - Modeling Code Example Metadata article, there are two ways I can retrieve programming language counts across any of these queries:
languages array from the DocsPage documentlanguage field from every CodeNode object in the nodes array from every DocsPage documentFor these queries, I have chosen to read the values of the languages array, which has this type definition:
// LanguagesArray is a custom type to handle unmarshalling languages.
type LanguagesArray []map[string]LanguageCounts

// LanguageCounts captures the counts of literalincludes and io-code-block directive instances for a specific language
// on a DocsPage. The `Total` count is a sum of both directive types, plus `code-block` and `code` directives on the page.
type LanguageCounts struct {
	LiteralIncludes int `bson:"literal_includes" json:"literal_includes"`
	IOCodeBlock     int `bson:"io_code_block" json:"io_code_block"`
	Total           int `bson:"total" json:"total"`
}
In practice, this means that every programming language becomes a string key in a map, and the value of that key is the LanguageCounts object that contains the total count for that language on the page. For example:
javascript: {
    LiteralIncludes: 2,
    IOCodeBlock: 2,
    Total: 9
}
So for each programming language string key, I can access the Total field value and get the number count of code examples in that programming language on that page.
I’m working with this array instead of directly with the code nodes for two reasons:
This query:
summarieslanguages array that contains the language counts for each canonical programming languageTotal field - i.e. javascript.TotalFor this query, we represent the data for each documentation set as a map[string]int. Each string key is the name of the programming language. The int value is the total count of code examples in that programming language. The data looks like map[programming-language]code-example-count.
Because we want to track this information for each documentation set, we store this programming language map itself as a value in a map where each string name is the name of the documentation set, creating a nested map. So the data structure we use to store the data is ultimately a map[string]map[string]int, where the values look like map[documentation-set-name]map[programming-language]code-example-count.
This example outputs a separate table for each documentation set, with counts segmented by programming language, where each table resembles:
The total count of code examples in project "atlas-cli" is: <number>

+-----------+-----------+------------+
| Language  | Count     | % of Total |
+-----------+-----------+------------+
| Bash      | <number>  | <percent>  |
| C         | <number>  | <percent>  |
| C++       | <number>  | <percent>  |
| etc.      | <number>  | <percent>  |
+-----------+-----------+------------+
This query returns an int count of code examples in a specific programming language within a single documentation set. So I might query for “JavaScript” code examples in the “node” Driver project and get an int count of ~1,100 code examples. We can use this query to get up-to-date counts if a stakeholder has questions about the distribution of a programming language within a specific docs set.
This is a subset of the prior query which outputs only the code example counts for a single language within a documentation set, instead of a table that breaks down all of the counts. This query came first, and then I expanded it to the complete language breakdown query to give us a more comprehensive view.
This query:
summarieslanguages array that contains the language counts for each canonical programming languagejavascriptTotal field - i.e. javascript.Total to a running tally for the programming language in this documentation setFor each documentation set, we return the programming language string value and the int count of code examples for that programming language. Because we are checking only within a given documentation set, there is no need to store the value in a map and output a list across all documentation sets.
The output for this query resembles:
For the documentation set "atlas-cli", the total count of "javascript" code examples is: <number>
Programming language gives us a starting point to understand our code example distribution. But how can we understand what’s in those 10,000 JavaScript code examples? How many of them are syntax examples for various APIs or configuration objects versus usage examples that show the code in context?
To help dig deeper, we assigned every code example a category. For more details, refer to the What is a code example? article in this series.
To look at this data through a different lens, I added queries to break down the counts for a specific category across documentation set, product, and sub-product.
This query:
summariesnodes array that contains all of the code examples on the pagecategory fieldFor this query, we represent the data for each documentation set as a map[string]int. Each string key is the name of the code example category. The int value is the total count of code examples in that category. The data looks like map[category-name]code-example-count.
Because we want to track this information for each documentation set, we store this category map itself as a value in a map where each string name is the name of the documentation set, creating a nested map. So the data structure we use to store the data is ultimately a map[string]map[string]int, where the values look like map[documentation-set-name]map[category-name]code-example-count.
This example outputs a separate table for each documentation set, with counts segmented by category, where each table resembles:
The total count of code examples in project "atlas-cli" is: <number>

+-----------------------+-----------+------------+
| Category              | Count     | % of Total |
+-----------------------+-----------+------------+
| Syntax example        | <number>  | <percent>  |
| Configuration example | <number>  | <percent>  |
| Usage example         | <number>  | <percent>  |
| etc.                  | <number>  | <percent>  |
+-----------------------+-----------+------------+
In our organization, each documentation set corresponds to a single product. We store the product name in a product field on every documentation page document, but this value is the same for every documentation page in a given documentation set.
Multiple documentation sets may belong to a single product. For example, we treat our Drivers as a single product, but each driver has its own documentation set. For example, the documentation sets for the Go Driver and the Node.js Driver both belong to the Drivers product. So these queries collect a running tally of Product counts that may span multiple documentation sets.
The output from these queries is useful for higher-level stakeholders in the organization who do not necessarily need to know the breakdown at the documentation set level.
This is a starting point to get a high-level summary of how many code examples exist for a given product.
This query:
summariescode_nodes_total field that contains the count of code examples currently on the pageproduct field to use when incrementing the product totalWe write the total value output to a map[string]int data structure, which we use when we print the output. The string key is the product name, and the int count is a total breakdown of code examples for that product. The data looks like map[product-name]code-example-count.
Because multiple documentation sets may contain documentation for a given product, we add the total count from the query output to a running tally of the total for that product. The data looks like map[product-name]total-running-code-example-count.
This example outputs one table that breaks down the counts segmented per product, where the table resembles:
The total count of code examples across all products is: <number>

+-----------------------+-----------+------------+
| Product               | Count     | % of Total |
+-----------------------+-----------+------------+
| Atlas                 | <number>  | <percent>  |
| Drivers               | <number>  | <percent>  |
| etc.                  | <number>  | <percent>  |
+-----------------------+-----------+------------+
This query:
summariesproduct field that contains the string name of the productlanguages array that contains the language counts for each canonical programming languageTotal field - i.e. javascript.TotalTotal field to a running tally grouped first by product, and then by programming languageIn our organization, each documentation set corresponds to a single product. So we can output the product name once per documentation project, and use the count for that documentation project as the count for the product.
We write the total value of each programming language to a map[string]int data structure, which we use when we print the output. The string key is the programming language, and the int count is the number of code examples for that programming language in that product. The data looks like map[programming-language]code-example-count. We store this programming language map itself as a value in a map where each string name is the name of the product, creating a nested map. So the data structure we use to store the data is ultimately a map[string]map[string]int, where the values look like map[product-name]map[programming-language]code-example-count.
Because multiple documentation sets may belong to a single product, we add the total count from the query output to a running tally of the total for that product. The data looks like map[product]total-running-code-example-count.
This example outputs a separate table for each product, with counts segmented by programming language, where each table resembles:
The total count of code examples in product "Atlas" is: <number>

+-----------+-----------+------------+
| Language  | Count     | % of Total |
+-----------+-----------+------------+
| Bash      | <number>  | <percent>  |
| C         | <number>  | <percent>  |
| C++       | <number>  | <percent>  |
| etc.      | <number>  | <percent>  |
+-----------+-----------+------------+
This query:
summariesproduct field that contains the string name of the productnodes array that contains all of the code examples on the pagecategory fieldproduct and then by categoryWe write the total value of each code example category to a map[string]int data structure, which we use when we print the output. The string key is the category name, and the int count is the number of code examples for that category in that product. The data looks like map[category-name]code-example-count.
Because we want to track this information for each product, we store this data as a nested map[string]map[string]int, where the values look like map[product-name]map[category-name]code-example-count.
This example outputs a separate table for each product, with counts segmented by code example category, where each table resembles:
The total count of code examples in product "Atlas" is: <number>

+-----------------------+-----------+------------+
| Category              | Count     | % of Total |
+-----------------------+-----------+------------+
| Syntax example        | <number>  | <percent>  |
| Configuration example | <number>  | <percent>  |
| Usage example         | <number>  | <percent>  |
| etc.                  | <number>  | <percent>  |
+-----------------------+-----------+------------+
In our organization, each documentation set may contain documentation for 0 or more sub-products. We store the sub-product name in a sub_product field only on documentation page documents that apply to a sub-product. Some pages omit this field entirely where they document something that is not a sub-product.
Sometimes, a single documentation set corresponds entirely to a single sub-product. For example, Atlas CLI is a sub-product of Atlas; it’s our command-line tool to programmatically configure Atlas. Atlas CLI has its own documentation set, so every page in this documentation set corresponds to the Atlas CLI sub-product.
In other cases, a documentation set contains no documentation for any sub-product. For example, we group our Drivers into a singular product, but no driver documentation set contains any pages that document a sub-product. So none of the documents in a driver documentation set contain the sub_product field.
In other documentation sets, the documentation set may contain documentation for multiple sub-products. For example, our Atlas product documentation contains pages that document the Atlas Search and Atlas Vector Search sub-products. It also contains pages that do not document any sub-product.
Every page corresponds to either no sub-products, or a single sub-product.
This query’s output is useful for higher-level stakeholders in the organization who do not necessarily need to know the breakdown at the documentation set level.
This is a starting point to get a high-level summary of how many code examples exist for a given sub-product.
This query:
summariessub_product fieldcode_nodes_total field that contains the count of code examples currently on the pagecode_nodes_total field to a running tally for the given sub_product string valueWe write the total value output to a map[string]int data structure, which we use when we print the output. The string key is the sub-product name, and the int count is the number of code examples for that sub-product. The data looks like map[sub-product-name]code-example-count.
Because multiple documentation sets may contain documentation for a given sub-product, we add the total count from the query output to a running tally of the total for that sub_product. The data looks like map[sub-product]total-running-code-example-count.
This example outputs one table that breaks down the counts segmented per sub-product, where the table resembles:
The total count of code examples across all sub-products is: <number>

+-----------------------+-----------+------------+
| Sub-product           | Count     | % of Total |
+-----------------------+-----------+------------+
| Atlas Operator        | <number>  | <percent>  |
| Search                | <number>  | <percent>  |
| Vector Search         | <number>  | <percent>  |
| etc.                  | <number>  | <percent>  |
+-----------------------+-----------+------------+
This query:
summariessub_product fieldlanguages array that contains the language counts for each canonical programming languageTotal field - i.e. javascript.Total to a running tally for the programming language for the given sub_product string valueWe write the total value of each programming language to a map[string]int data structure, which we use when we print the output. The string key is the programming language, and the int count is the number of code examples for that programming language in that sub-product. The data looks like map[programming-language]code-example-count.
We store this programming language map itself as a value in a map where each string name is the name of the sub-product, creating a nested map. So the data structure we use to store the per sub-product is a map[string]map[string]int, where the values look like map[sub-product-name]map[programming-language]code-example-count.
Because each sub-product rolls up to a product, we decided to group the sub-products by product. So this nested map is itself stored in a map, creating a map[string]map[string]map[string]int data structure. The values look like map[product-name]map[sub-product-name]map[programming-language]code-example-count.
Because multiple documentation sets may contain examples related to a specific sub-product, we add the total count from the query output to a running tally of the total for that sub-product. The data looks like map[sub-product]total-running-code-example-count.
This example outputs a separate table for each sub-product, with counts segmented by programming language, where each table resembles:
Programming Language Counts for Atlas - Vector Search
Total code examples by Vector Search: <number>

+-----------+-----------+------------+
| Language  | Count     | % of Total |
+-----------+-----------+------------+
| Bash      | <number>  | <percent>  |
| C         | <number>  | <percent>  |
| C++       | <number>  | <percent>  |
| etc.      | <number>  | <percent>  |
+-----------+-----------+------------+
This query:
summariessub_product fieldsub_product field that contains the string name of the sub-productnodes array that contains all of the code examples on the pagecategory fieldsub_product and then by categoryWe write the total value of each category to a map[string]int data structure, which we use when we print the output. The string key is the category name, and the int count is the number of code examples for that category in that sub-product. The data looks like map[category-name]code-example-count.
Because we want to track this information for each sub-product, we store this data as a nested map[string]map[string]int, where the values look like map[sub-product-name]map[category-name]code-example-count.
Because each sub-product rolls up to a product, we decided to group the sub-products by product. So this nested map is itself stored in a map, creating a map[string]map[string]map[string]int data structure. The values look like map[product-name]map[sub-product-name]map[category-name]code-example-count.
Because multiple documentation sets may contain examples related to a specific sub-product, we add the total count from the query output to a running tally of the total for that sub-product. The data looks like map[sub-product]total-running-code-example-count.
This example outputs a separate table for each sub-product, with counts segmented by code example category, where each table resembles:
Category Counts for Atlas - Vector Search
Total code examples by Vector Search: <number>

+-----------------------+-----------+------------+
| Category              | Count     | % of Total |
+-----------------------+-----------+------------+
| Syntax example        | <number>  | <percent>  |
| Configuration example | <number>  | <percent>  |
| Usage example         | <number>  | <percent>  |
| etc.                  | <number>  | <percent>  |
+-----------------------+-----------+------------+
While discussing the “what is a code example” question, different stakeholders across the organization had ideas of things that should or should not count as code examples. Some of those theories relate to the length of a code example. Some stakeholders felt that one-line code examples should not count as code examples. Others only incidentally cared about length; they wanted to know how many “complex” or “real-world” usage examples we had.
With the volume of code examples we have, we simply can’t look at each one and decide whether it’s a “real-world” usage example. So I started thinking about what sort of proxies we might use to try to draw conclusions based on various stakeholder inputs.
I added queries to assess code example complexity in the following ways:
For the purposes of determining whether a code example is “one line”, we:
We went with a character count over trying to count newlines because the character count was easier to apply consistently. There was no need to try to normalize newlines before/after the code example line(s), or deal with any other oddities related to newlines. This query can also be done using a MongoDB aggregation operator, $strLenCP, which is more performant than parsing the text of every code example for newline characters.
This query:
summariesnodes array that contains all of the code examples on the pagecategory fieldcategory isn’t "Usage example"For this query, we represent the data as a map[string]int. Each string key is the name of the documentation set. The int value is the total count of code examples that are shorter than 80 characters in that documentation set. The data looks like map[documentation-set]short-code-example-count.
This query outputs one table that breaks down the counts segmented per documentation set, where the table resembles:
The total count of one-line usage examples across all documentation sets is: <number>

+-----------------------+-----------+------------+
| Documentation set     | Count     | % of Total |
+-----------------------+-----------+------------+
| Atlas CLI             | <number>  | <percent>  |
| Atlas                 | <number>  | <percent>  |
| Atlas Operator        | <number>  | <percent>  |
| etc.                  | <number>  | <percent>  |
+-----------------------+-----------+------------+
This query also uses the very convenient $strLenCP aggregation operator to count the number of characters in every code example in a documentation project. Then some clever sorting, summing, and calculating gives us a few key metrics for each documentation project:
I wrote this query because I wondered if any of our particular documentation sets had longer or shorter code examples than the others, and what the median length of a code example might be. Again, length is an imperfect proxy for “real-world usage example”, but short code examples are inherently lacking in context or nuance. In spite of being an imperfect proxy, it’s a darn effective signal.
Comically, I found a number of documentation sets where the Min was only three characters. A three-character code example! How can three characters possibly warrant being a code example?
On the other extreme, I found a number of documentation sets where the Max was between 12,000 and 14,000 characters. If we assume 80 characters per line, that’s 150 to 180 lines of code in a single example. That’s a chonky example that probably should be broken up. If it’s intended to be a runnable example, I’d argue we should link out to that in a git repo or gist somewhere versus displaying an example that long inline in a documentation page.
I expected to find the median code example length was between 5 and 10 lines, or between 400 and 800 characters, but I was wrong! Many documentation sets averaged a Median code example character count between 100 and 150 characters, or around 1.5 to 2 lines of code.
This query:
summariesnodes array that contains all of the code examples on the pageminLength accumulator using the $min operatormaxLength accumulator using the $max operatorsortedLengths accumulator using the $push operatormedianLength field to the output containing the array element at the median position in the sortedLengths arrayFor this query, we represent the data as a purpose-build struct:
// CodeLengthStats holds character counts for the code example lengths in a given collection.
type CodeLengthStats struct {
	Min            int `bson:"minLength"`
	Median         int `bson:"maxLength"`
	Max            int `bson:"medianLength"`
}
Because we want to capture this data by documentation set, we store this struct in a map[string]CodeLengthStats, where the string key is the name of the documentation set and the CodeLengthStats is our purpose-built struct that contains the Min, Median, and Max length for code examples in that documentation set. The data looks like map[documentation-set]CodeLengthStats.
The output for this query is one table, which breaks down the data segmented by documentation set, but the display columns are a bit different than most of the other tables:
+-----------------------+----------+----------+----------+
| Documentation set     | Min      | Med      | Max      |
+-----------------------+----------+----------+----------+
| Atlas CLI             | <number> | <number> | <number> |
| Atlas                 | <number> | <number> | <number> |
| Atlas Operator        | <number> | <number> | <number> |
| etc.                  | <number> | <number> | <number> |
+-----------------------+----------+----------+----------+
Our leadership team is particularly interested in a subset of code examples that we refer to as “applied usage examples.” These are usage examples that have more context or resemble more real-world usage. Developers consistently request more examples of this type, so we have scoped work to provide more of them. After running the first audit, we were asked to write tooling that we could re-run weekly and provide counts of new applied usage examples to the leadership team. They could use these counts to track our progress toward a a specific metric we set relative to this.
This particular request has evolved several times. Initially, I wrote a query that checked for:
We reported this simple count in a weekly meeting as a running tally toward our goal.
Over time, based on requests from leadership, I have modified this query to provide more data about where these code examples have been added.
We have also expanded our “sub-product” listing for this particular query beyond the canonical sub-products that our Information Architect identified in our docs-wide taxonomy. Leadership has key focus areas they want to track that include important product features that are strategic to our company goals, where those features are not actually sub-products. Rather than add a separate “focus area” column, which could further confuse people who are using the data, I have updated the query logic to treat these focus areas as “sub-product” values. Beyond just canonical sub-product, features or focus areas now also report in this column.
To further muddy the waters, our organization has no formal way to recognize content that fits into these focus areas. We do have a meta keywords field available on the documentation page, and I started ingested these values into the audit tooling so we could query the code examples by keyword. However, in examining the data, I found that we do not apply keywords consistently across documentation sets. Many pages that should have a focus area keyword are missing the keyword. Since I can’t rely on this value being accurate, I am once again parsing the page URL for specific substrings that represent non-sub-product focus areas, hoping the URL value contain those keywords where applicable, and attributing new applied usage examples on those pages to their relative focus areas/faux sub-products.
This query:
summariesnodes array that contains all of the code examples on the pagedate_added field, filtering out any code example where this value is older than a week agocategory field, filtering out any code example where the category isn’t "Usage example"product and sub_product valuesFor this query, we represent the data as a series of purpose-build structs:
// NewAppliedUsageExampleCounterByProductSubProduct aggregates counts and page IDs for pages with new usage examples across collections.
// Used by the aggregations.FindNewAppliedUsageExamples function.
type NewAppliedUsageExampleCounterByProductSubProduct struct {
	ProductSubProductCounts map[string]map[string]int
	ProductAggregateCount   map[string]int
	PagesInCollections      map[string][]PageIdNewAppliedUsageExamples
}

type PageIdNewAppliedUsageExamples struct {
	ID                      ProductSubProductDocumentID `bson:"_id"`
	NewAppliedUsageExamples []common.CodeNode           `bson:"new_applied_usage_examples"`
	Count                   int                         `bson:"count"`
}

// ProductSubProductDocumentID represents the structure for the grouped _id field.
type ProductSubProductDocumentID struct {
	Product    string `bson:"product"`
	SubProduct string `bson:"subProduct"`
	DocumentID string `bson:"documentId"`
}
For reporting in the weekly meeting, the query outputs an aggregate table resembling:
The total count of new applied usage examples in the last week is: <number>

+-------------+-----------+-------------+-----------+
| Product     | Count     | Sub-product | Count     |
+-------------+-----------+-------------+-----------+
| Atlas       | <number>  | Atlas CLI   | <number>  |
|             |           | Search      | <number>  |
| Drivers     | <number>  | None        |           |
| etc.        | <number>  |             |           |
+-------------+-----------+-------------+-----------+
Because there are sometimes requests for additional details, we also output more detailed tables that we can refer to as needed:
Total new Applied Usage Example Counts by Page in Collection "cloud-docs"

+---------+---------------+-------------+-----------+
| Product | Sub-Product   | Page ID     | Count     |
+---------+---------------+-------------+-----------+
| Atlas   | Search        | quick-start | <number>  |
|         | Vector Search | tutorial    | <number>  |
| etc.    |               |             | <number>  |
+---------+---------------+-------------+-----------+
These supplemental tables let us dig deeper if the numbers seem surprising, or if we want to surface that a particular project has landed, such as a Quick Start revamp.
After creating this tooling, the docs org got a request to change a placeholder value that exists in some code examples across our documentation. Because our docs exist across 50+ docs repositories, there isn’t an easy way to check how many instances of this placeholder exist across our documentation corpus. Fortunately, now that we ingest the code examples weekly into this database, I was able to write a query that checked for the placeholder as a substring in every code example across all of our documentation sets.
This query:
summariesnodes array that contains all of the code examples on the pagecode field that contains the code example as a string, using a case-insensitive regex operator to filter out code examples that do not contain the specified substringFor this query, we represent the data as a map[string]int. Each string key is the name of the documentation set. The int value is the number of code examples containing the substring in the documentation set. The data looks like map[documentation-set]matching-code-example-count.
This query outputs one table that breaks down the counts segmented per documentation set, where the table resembles:
The total count of string "placeholder" across all documentation sets is: <number>

+-----------------------+-----------+------------+
| Documentation set     | Count     | % of Total |
+-----------------------+-----------+------------+
| Atlas CLI             | <number>  | <percent>  |
| Atlas                 | <number>  | <percent>  |
| Atlas Operator        | <number>  | <percent>  |
| etc.                  | <number>  | <percent>  |
+-----------------------+-----------+------------+
For this initial query, we only wanted to understand the impact of making this change, so I printed the results as a count of the number of times this string appeared in a documentation set. If we wanted to ticket out the work, we could instead output a list of documentation pages where one or more code examples contain the specific substring.
Earlier this year, we released a major version update for our Go Driver. The major version bump contained changes that affected essentially every Go Driver code example across our documenation. We wanted to know which documentation pages contained code examples using the Go Driver so we could plan work to update them. Because our docs exist across 50+ docs repositories, there isn’t an easy way to check for Go code examples manually in our documentation, but it was relatively simple to write a query for this using our code example audit data.
This query:
summariesGototal field that is greater than 0For this query, we write the page ID and count of Go code examples on the page to a map[string]int data structure, which we use when we print the output. Each string key is the name of the documentation set. The int value is the number of Go code examples containing in the documentation set. The data looks like map[page-id]go-code-example-count.
Because we want to track this information for each collection, we store this page ID map itself as a value in a map where each string name is the name of the documentation project, creating a nested map. So the data structure we use to represent the data is ultimately a map[string]map[string]int, where the values look like map[documentation-project-name]map[page-ID]go-code-example-count.
This query outputs a separate table for each documentation set, with a list of page IDs and counts of Go code examples on each page, where each table resembles:
The total count of Go code examples in project "atlas-cli" is: <number>

+---------------------------+-----------+------------+
| Page ID                   | Count     | % of Total |
+---------------------------+-----------+------------+
| aggregation|tutorial      | <number>  | <percent>  |
| quick-start               | <number>  | <percent>  |
| connect|connection-string | <number>  | <percent>  |
| etc.                      | <number>  | <percent>  |
+---------------------------+-----------+------------+
The page ID most closely maps to our documentation file structure; the aggregation|tutorial page is a file called tutorial.txt in this project’s aggregation directory. This information is useful for writers who need to perform the updates. If we instead wanted make it easy to quickly visually inspect the page to determine whether the example needed to be updated, we could change the query to output page URL instead of page ID.
Because we also have the code example text, if we wanted to check for Go code examples containing a specific API - for example, if this update had renamed an API from a more specialized bulkUpdate API to a more general bulkWrite API that took an update argument - we could instead find every page ID that contains Go code examples where one or more examples contains the substring bulkUpdate.
Since I was writing the ingest tooling as I was creating the audit report, I was doing a fair amount of flying the plane while building it in mid-air. Sometimes, the numbers I got back from my queries were not consistent with my expectations. So I wrote some debugging queries to help me identify and fix issues with data in the database.
Detailing the specifics here wouldn’t be helpful, as it’s very tied to our implementation, but at a high level, I wrote debugging queries to help me identify:
languages array versus the nodes arrayHaving these queries available helped me find and fix issues with our data, and also debug problems with the ingest tooling.
Once I started using the audit tooling to debug our database, I had a need to update the data. If the data was bad or had changed, I needed to be able to fix it. So I expanded the little tool that I wrote to slice data to give it the ability to make updates to the data. At the time of this writing, my little query utility can now also:
product name values to handle missing product names or changes to product namesproject name values to handle changes to our documentation set namesI also added the ability to manually back up the database for testing purposes, to preserve the data before making changes in case we need to revert. I’ve also baked this functionality into our weekly ingest job, so now the job always backs up the database before ingesting changes to code examples during the last week.
For these, and many other reasons I haven’t detailed here due to the length of this article, our code example database and reporting utility that started as a tool for our audit has become a key component of our day-to-day business operations.
In the next article, I’ll share some of our key audit conclusions (coming soon).
Later, I’ll detail some of the changes we’ve made to run the tooling weekly and why and how that has become a part of our regular business operations.
In which I validate a 23.7k-star skill mega repo and discover problems the star count won't tell you.
In which I show you how I made multiple Hugo sites agent-friendly.
In which I deep dive on a Stripe Skill, and what it means for the industry.

