


Audit - Modeling Code Example Metadata
In which we decide what information to store, and how.
MongoDB is a document database. Developers love document databases because they make it easy to evolve a data model. But that wide-open flexibility can be a mixed blessing. It’s easy to add data without thinking very much about how you want to use it and what structure the data should have.
For my hackathon project, I had to consider what questions I wanted to ask about my data. Those questions would drive what structure my data should have. Before I got into importing a lot of data and making charts, I needed to nail down the data model.
I looked at what data I had available in the Google Sheets import. And I asked myself what insights I was hoping to gain from this data. That drove the structure I needed for my data.
My Google Sheets data had these details:
I wanted to compare changes to the data over time. I needed to track many weekly analytics entries for each documentation page.
The only unique identifier I had in the Google Sheets data to tie the analytics back to a given page was the URL. So I would need to look up documents based on the URL in the spreadsheet. But the URL isn’t a nice, human-readable string that can quickly make it obvious to us what we’re looking at. So I probably wanted page titles.
I also wanted to be able to track other information about a page. I wanted to slice my data based on what SDK the page belonged to or which variation of our product it pertained to. So I brainstormed about what information I wanted to be able to track, and how I might want to break down the data.
I was a generalist writer for many years before I focused on developer documentation. I spent years working in marketing and alongside marketing and product folks. I’ve been the person managing Google Analytics in some of my prior jobs. This history means I have often wondered about things like:
I’d love to be able to cast a wider net and look for additional insights. But these require access to information I don’t have. Some of those bigger-picture questions include things like:
Without data from other parts of the organization, I can’t answer the wider questions. But I can slice our docs consumption metrics relative to my smaller questions. This information can help us align with various stakeholders in the organization. It can help us gauge the success of various projects.
It’s worth noting that interpreting analytics can be very subjective. In a marketing context, a low time on page and a low number of pages per session may signal poor performance. But in documentation, a low time on page and a low number of pages per session can signal success.
In docs, users may not spend much time on the page because they get the answer they need right away. They may not visit multiple pages because they came for a single answer and got it. That’s a good thing!
I view analytics as one signal among many when evaluating docs success. Analytics are most applicable as a supporting data point taken together with:
Teams in orgs that don’t have access to this other data may use analytics as a proxy for other success measures. Given how easy it is to misinterpret data, we should avoid putting too much weight on analytics.
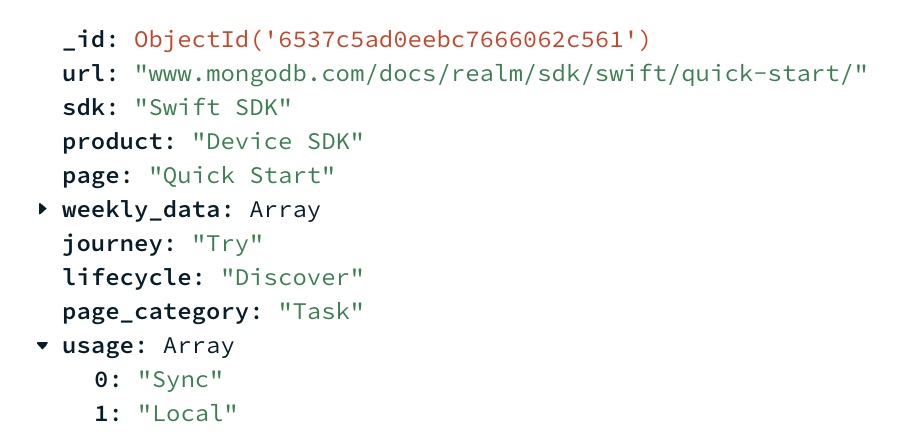
With those questions in mind, this is what I came up with. Each documentation page URL becomes a document in my collection. Each document represents a single documentatin page. A document has the following data:
_id: an ObjectId field whose value is a unique identifier for the document in my collection. The _id name and ObjectId data type is a convention in MongoDB Atlas.
url: a string field whose value is the URL of the documentation page. I could look up the url to match the weekly data in the spreadsheet with my data in MongoDB. I’ll change this to an array of strings soon. We’re planning to do some restructuring, and some of those documentation URLs will change. I don’t want to lose the historic data for a page, so I need to be able to store multiple URLs for a page.
page: a string field whose value is a page title, such as “Create Objects” or “Open a Realm.” I want to track the performance of specific pages. This also provides a human-readable page title to anyone looking at the data.
sdk: a string field whose value is the specific SDK the page belongs to, such as “Swift SDK” or “C++ SDK.” Every SDK has some of the same pages for common operations, such as “Open a Realm” and “Create Objects.” Some SDKs also have SDK-specific pages, such as “Swift Concurrency” or “Use Realm with Swift Actors.” I want to track changes to a specific SDK over time, so this lets me segment the data on the SDK.
product: a string field whose value is the product that the documentation pertains to. In one documentation site, we have “Device SDK” and “Realm Studio” - a GUI client to view and query the database. This lets me easily view all of the SDKs together, or view Realm Studio docs.
I could have achieved something similar by using other operators in my queries. For example, instead of querying on 'product':'Device SDK', I could have queried on documents where the SDK field did not exist. I could assume matching documents pertain to Realm Studio. But that requires the person doing the queries to know what content exists in the collection. I want my teammates to be able to add or change queries to answer specific questions. Being more explicit makes it easier for my teammates to understand what data exists and how they can access it.
lifecycle: a string field whose value is which part of the app development lifecycle the page pertains to. I went with:
journey: a string field whose value is which part of the user journey the page pertains to. I went with:
page_category: a string field whose value is “Task” or “Feature”.
usage: an array field whose value reflects whether users are using the open source version of our product, or our enterprise offering. Some of our documentation pages apply to both versions of the product. I made this an array field so it could contain multiple values.
weekly_data: an array of objects, each corresponding to a single week of data imported from the Google Sheet. The weekly data tracks our metrics, plus week number and year for comparisons over time.
If you’re familiar with software development, you may notice that a lot of these string fields have a small selection of fixed values. If I were writing this as an app, I would make these fields enums to enforce correctness and simplify discovering the values. MongoDB doesn’t have an enum data type, though.
Developers often debate how to store enum values in MongoDB. Integers are arguably more efficient to query, and you can map them to strings. But storing strings directly gives you immediate understanding of the data. This collection will never have a huge number of documents or values to query. Making these fields strings makes the data more understandable for my teammates. This also lets me use the values of these fields as labels when I get to making Charts.
Now that I’ve decided how I want to structure my data, I can transform my initial weekly data import to match this structure. I talked in Part 1 about how I used the mongoimport tool to load a single weekly spreadsheet into Atlas. Now I can use MongoDB’s aggregation tools to create the document structure I want for each row of the spreadsheet that I imported.
MongoDB represents data transformation as a “pipeline.” A pipeline may contain one or many “stages,” and each stage represents a specific type of operation. You can stack multiple stages to perform complex data transformations.
Most of the aggregation I did for my hackathon project was simple, and broke down to a very similar set of stages:
url field of my data to get only the documents whose URLs match a specific pattern. For example, a specific SDK.sdk: "Swift SDK"._id field that MongoDB populated for each document when I ran the initial mongoimport.I used a combination of the Atlas Aggregation UI and the MongoDB Compass GUI to set up each aggregation stage. These tools made it easy to verify that I got the documents and data structure I expected for each stage. They provide a sample of up to 10 documents for each aggregation stage in your pipeline. You can check your work and play with different queries and stages to get the desired output. You can also export your pipelines for use in other tools.
Represented for the shell, the pipeline above - which was the core pipeline I used to do a lot of my data structuring - looks like this:
[
  {
    $match:
      {
        url: {
          $regex: /sdk\/react-native/,
        },
      },
  },
  {
    $addFields:
      {
        sdk: "React Native SDK",
      },
  },
  {
    $merge:
      {
        into: "SDKDocs",
        on: "_id",
        whenMatched: "replace",
      },
  },
]
I spent somewhere between half a day and a day manually performing these aggregations. I had to think about what data I could try to match to do as many pages as possible in each sweep.
I discovered along the way how inconsistent we have been in our URL structures and page names. A project for another day! But this meant I had to hunt down a lot of variations, and deal with a lot of one-offs.
By the end, I had done the easy stuff and had to go hunting down individual documents that were missing fields so I could populate them. That aggregation looked something like this:
$match stage to get only a subset of the documents.
$regex operator to match on URLs containing a specific pattern. Or try to match something I had already tagged with a value - for example sdk: "React Native SDK".page.$match stage to get only a specific document matching on _id, to tag it individually. This let me keep the sample output from the first $match stage in my GUI, and quickly work through each document by _id to whittle away individual pages.$addFields to manually tag it with the field and value I wanted.$merge to merge it back into the collection.[
{
$match:
{
url: {
$regex: /sdk\/react-native/,
},
page: {
$exists: false,
},
},
},
{
$match:
{
_id: ObjectId("6537c5ad0eebc7666062c55f"),
},
},
{
$addFields:
{
page: "Landing Page",
},
},
{
$merge:
{
into: "SDKDocs",
on: "_id",
whenMatched: "replace",
},
},
]
After manually structuring the majority of my data, it was time to start running the weekly import to ingest several months of data. I went over this in Part 1 - starting with the section titled “Writing an Atlas Function to insert data into the collection.”
After some minor hiccups with authenticating to my endpoint, everything just worked!
With the setup done, I could finally get into the meat of my hackathon project - making MongoDB Charts to make it easy for my team to visualize the data I loaded into Atlas. Check it out in Part 3 of this series.
In which we decide what information to store, and how.
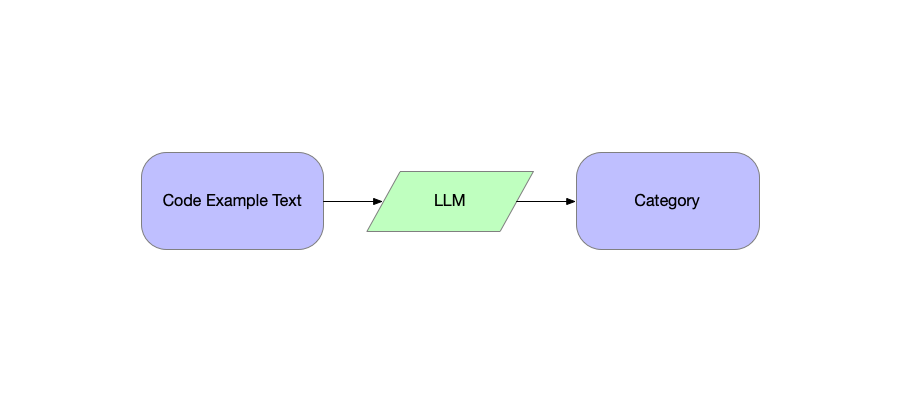
In which we have an LLM help us assign categories to code examples.
In which we explore the best way to get content and work with audit data.